05/02/2013
Objective: To determine how the volume of the gas affects its pressure.
Objective: To determine how the volume of the gas affects its pressure.
Background information:
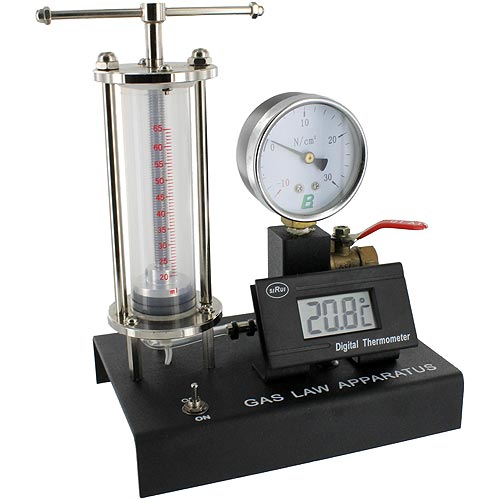
A gas law apparatus, as its name indicates, is used to study the different laws and properties of gases, such as pressure or volume and to demonstrate their relationships. It is composed of the thermometer (to indicate the temperature of the gas while changing pressure and volume), the piston with the cylinder (to change the variables), the pressure indicator and the valve that allows the compressed air to escape. (FLINN, 2011)
It has an easy mechanism that makes you able to test the relationship between pressure and volume in gases. We have to move the piston up or down so that the pressure decreases (moving it from the lower part to he top of the cylinder) or increases (compressing the air from the upper part to the lower one)
It has an easy mechanism that makes you able to test the relationship between pressure and volume in gases. We have to move the piston up or down so that the pressure decreases (moving it from the lower part to he top of the cylinder) or increases (compressing the air from the upper part to the lower one)
There is a directly proportional relationship between volume (V) and temperature (T), (Charle's-Gay Lussac's Law), which says that when volume increases, temperature increases.
Even though we are not going to focus on the temperature, we have noticed that the temperature changes very little while the volume of the gas changes.
Procedure:
Spin around the handle, so when it goes downwards, the volume of the gas decreases; and when it goes upwards, the volume increases.
In order to take notes of the results, move the handle up or downwards, so it reaches the volume indicated on the tables below.
Table 1: Table showing the relationship between the volume of air and its pressure

We have been measuring pressure above atmospheric pressure (extra pressure).
In order to calculate the atmospheric pressure (1 atm, which is equal to 101325 Pa) in hectoPascals, we have done a conversion factor:

Then, we added this value to the pressure we obtained in the experiment.
In the fourth column we can see the volume we obtained, and in the third, the volume obtained added to the atmospheric pressure.
Graph 1 (a): Graph showing how the air pressure decreases while the volume increases
Pressure (hPa)
 Volume (mL)
Graph 1 (b): Graph showing the inverse of the data we have obtained in this experiment (Volume against Pressure)
Pressure (hPa)
 Volume (mL)


Pressure (hPa)

Table 2: Table showing the pressure and inverse pressure of air in hectoPascals obtained while we increase the volume of it.

Graph 2 (a): Graph showing how the pressure decreases while the volume of air increases.
Pressure (hPa)

Volume (mL)
Graph 2 (b): Graph showing how inverse pressure of the data obtained above increases at the same time the volume increases.
Pressure (hPa)

Volume (mL)
Conclusions
As we
can see in the video, tables and graphs above, the pressure increases
while the volume decreases. This experiment is just a demonstration of “Boyle’s
Law”.
We’ve
concluded that the volume of the gas and its pressure are inversely
proportional.
We have found this
experiment very interesting because we have understood this law very quickly, without any difficulties and in a practice way.
Bibliography
FLINN, S. (2011): The Gas Law apparatus. Taken from:
http://www.flinnsci.com/store/Scripts/prodView.asp?idproduct=22163
Bibliography
FLINN, S. (2011): The Gas Law apparatus. Taken from:
http://www.flinnsci.com/store/Scripts/prodView.asp?idproduct=22163
No comments:
Post a Comment